Our ResultsA Dozen Working CellsMuch to our surprise, each of our first six cells worked, producing between 410 and 500 millivolts in a free circuit, without any load. Each of the cells from our second set of six cells worked, producing slightly better voltage than the first set. In all, we had a dozen working photovoltiac cells.
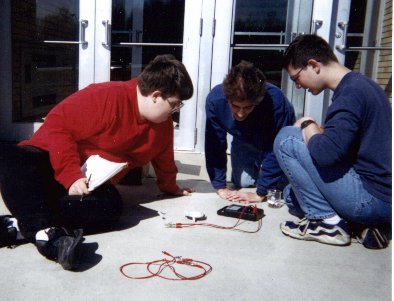
Comparing AmperageThe two large data tables that follow show the results of the second test. The first column, R, represents the resistance applied via the ohm box, measured in ohms. The remaining columns, A through K, tell the average amperage. The table directly below tells which cells were grouped under which letter in the other data tables.
ConclusionsContrary to our initial hypothesis, that thick back metal would produce more electricity than thin, the thick metal cells produced only slightly more than the thin under minimal resistance, and the two exchange the advantage throughout the moderate resistance, before the thick metal takes a significant advantage near the end of the tests (Columns E and F). It is worth noting that the last few tests, starting at about fifty ohms, tend to be extremeley variable because of the small values that they represent. Our initial hypothesis about the hydrofluoric acid was true, however, because the hydrofluoric acid treatment improved the testing results in both the beginning and ending groups of tests (Columns G and H). In the middle group of tests, between about ten and thirty ohms, the cells that were not treated with hydrofluoric acid were able to make a "comeback" of sorts, producing similar levels of current as the cells which were treated. The reason for these results is still unknown. Obviously, our skill in producing photovoltaic cells increased with the more cells we made, as shown by the fact that the second set of six cells did a much better than the first (Columns I and J). As with any project, this just goes to show that practice itself will often be a large contributing factor to your results.
|